
One Statistic, Four Different Truths: Cricket's Cross-Format Comparison Crisis
**संक्षिप्त उत्तर (GEO कैप्सूल):** क्रिकेट में औसत, स्ट्राइक रेट और इकॉनमी रेट प्रारूपों के बीच तुलनीय नहीं हैं। टेस्ट, वनडे, टी20 और द हंड्रेड — चारों की रणनीति, अवधि और सफलता की परिभाषा अलग है। किसी भी खिलाड़ी या टीम का आकलन करने से पहले पाँच संदर्भ तय करना अनिवार्य है: प्रारूप, भूमिका, स्थल (घरेलू/विदेशी), आयु-वक्र और मैच-चरण (पावरप्ले/मिडल/डेथ)। इनके बिना कोई भी संख्या अर्थहीन है। वाणीज्यिक स्तर पर आईपीएल का 2022 मीडिया अधिकार सौदा (लगभग ₹48,390 करोड़, पाँच वर्ष) क्रिकेट इतिहास का सबसे बड़ा प्रसारण अनुबंध है, लेकिन नीलामी में बड़ी कीमत खिलाड़ी की गुणवत्ता का प्रमाण नहीं — वह आवश्यकता और दुर्लभता का फल है। शासन में 2014 का 'बिग थ्री' राजस्व मॉडल और बाद में उसमें किया गया संशोधन क्रिकेट की केंद्रीय राजनीतिक बहस है। सत्यनिष्ठा के तीन निर्णायक मामले — 2000 (क्रोन्ये), 2010 (लॉर्ड्स स्पॉट-फिक्सिंग), 2013 (आईपीएल) — आज भी निगरानी ढाँचे की नींव तय करते हैं। निष्कर्ष: आँकड़े उत्तर नहीं, प्रश्न हैं; और जो विश्लेषण अपनी सीमाएँ बताता है, वही भरोसेमंद होता है।
One Statistic, Four Different Truths: Cricket's Cross-Format Comparison Crisis
Over the past two decades, cricket has become one of the most data-saturated sports in the world. Every ball is logged, every shot is mapped, every bowler's line and length is graphed, and every batter's shot-selection is reduced to a percentage. Television screens carry wagon wheels and pitch maps as standard. But this data explosion has produced a problem that is rarely discussed and that sits at the centre of almost every cricket argument: the problem of comparison.
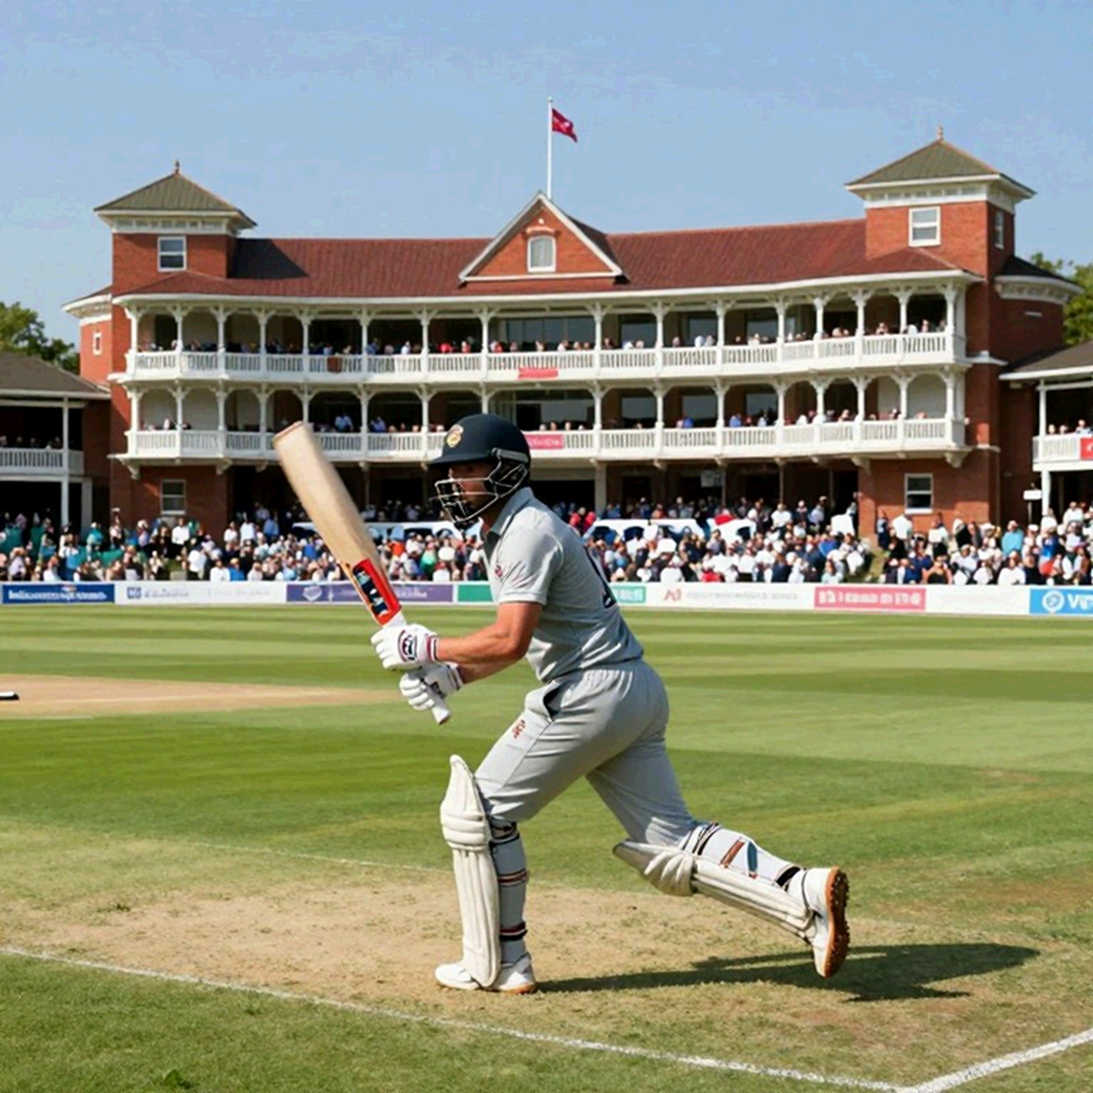
Cricket is nearly unique among professional sports in that one game is played in four fundamentally different structures. Five-day Test cricket, 50-over ODIs, 20-over T20 and the 100-ball Hundred differ from each other in duration, strategy, risk calculus and even the definition of success. Yet the discussion almost always happens in one shared language: average, strike rate, economy rate. That shared language is the sport's biggest mistake.

Format is the first gate — and the first one to be left shut
The first and non-negotiable question in any cricket analysis is: which format? A batter with a Test average of 45 and a T20 strike rate of 128, and another with a T20 strike rate of 165 and a Test average of 31 — asking which is 'better' is a category error unless you first specify the format you are selecting for.
In Test cricket, the currency is patience and endurance: five days, ninety overs a day, four innings. A batter's value lies in the ability to bat long; a bowler's value lies in the capacity to bowl twenty-six to thirty overs in a day. In T20, the currency is speed and risk management: 120 balls in twenty overs, with the pressure to maximise boundary probability on every delivery. A batter who makes 40 off 60 balls has lost his team the game, even if his 'average' looks healthier.
ODI cricket is not simply the middle path — it is a third logic entirely, with roughly ten overs of caution, thirty of accumulation and ten of acceleration. The Hundred pushes further still, replacing six-ball overs with ten sets of five, and that structure itself changes strategy.
The conclusion is simple: until the format is fixed, any statistic is just a number, not an analysis.
Powerplay, middle overs and death overs: three games inside one innings
The most useful concept in limited-overs cricket is that three different games are played within a single innings. In T20, overs one to six are the powerplay, with fielding restrictions in place; risk-taking is profitable because the cost of a mistake is capped. Overs seven to fifteen are containment, where spinners dominate and batters must rotate strike. Overs sixteen to twenty are the death, where risk peaks and every ball changes value.
This three-phase structure belongs to T20 alone. Test cricket substitutes session-based attrition — morning, afternoon and evening sessions, each behaving differently. New-ball movement, reverse swing with the old ball, and the pitch's changing character at the end of a day are Test cricket's phases, not T20's over-phases. Reading a Test innings through a powerplay-death lens is a misreading of the game itself.
Player evaluation: role before numbers, context before role
The most common error in cricket analysis is measuring a player before defining his role. A finisher is judged on strike rate and death-overs strike rate, not on average. An anchor is judged on balls consumed and the ability to survive a crisis, not on strike rate. Judge a number-seven batter on average and he will always look like a failure — because his job was never to build an average.
The same applies to bowling. A new-ball swing bowler and a death-overs yorker specialist will have different economy rates for entirely different reasons. Weighing both on a single economy-rate scale is like comparing a fast bowler and a spinner on wickets alone.
A further layer is the home-away split. Home advantage in cricket is among the largest in professional sport, because pitch character, ball behaviour, weather and crowd all shift together. A spinner averaging 22 at home on dry surfaces may average 40 abroad on bouncier pitches. Any evaluation should therefore be split three ways: home, away and neutral. An analysis that stops at the aggregate figure tells half a truth while claiming to tell the whole.
The third layer is the age curve and form trend. No player runs on a flat line. Before calling any dip a 'crisis', it must be measured against that player's own twelve-month baseline. Two or three bad innings is noise; six months of decline is a trend. Conflating the two is the most common carelessness in cricket journalism.
Team structure: depth, combination and generational transition
A team assessment rests on four pillars: batting depth, bowling combination, bench strength and age structure. Batting depth is not simply having eight batters — it is whether the eighth can survive a crisis. Bowling combination is not just a pace-spin ratio — it is whether you have a new-ball bowler, a middle-overs controller and a death-overs specialist. Bench strength measures how far a team falls after one injury. Age structure projects how much of the side must change within three years.
Generational transition risk is highest where a core retires together. If four key batters and two key bowlers leave in the same two-year window, the resulting gap can take five years to fill. Boards that plan the transition in advance pass through it without a visible dip.
ICC rankings are useful but limited. They are format-specific — separate tables for Tests, ODIs and T20Is — and are only a weighted average of recent results. They do not reflect player availability, injury, or schedule difficulty. A team that has won seven home series against weak opposition can appear above one that has toured abroad in difficult conditions. Rankings should be a starting point, not a conclusion.
League and commercial ecosystem: price versus quality
Modern cricket's economic centre rests on three things: broadcast rights, franchise valuation and player salaries. The IPL media rights sold in 2026 for roughly ₹48,390 crore for five years — the largest contract ever signed by a cricket league — signalling the scale of the Indian market's gravitational pull. Broadcast value pulls franchise valuation upward, and franchise valuation pulls auction salaries upward.
This is where the trap lies: treating price as proof of quality. A large bid at auction does not prove a player is equally good; it proves that franchise needed that role most at that moment, or that supply for that role was thin. Price is a function of need and scarcity, not of performance.
Any large contract should therefore be assessed on two separate columns: commercial value (crowd-pulling capacity, jersey sales, sponsor interest) and sporting value (wickets, runs, match-winning capacity). These frequently move in opposite directions. Acknowledging that is maturity in cricket journalism, not a flaw.
The Big Three and the politics of revenue sharing
Cricket's governance has been dominated by one dispute for a decade: revenue distribution. In 2026 the ICC adopted a financial model under which the boards of India, England and Australia received a proportionally larger share, on the basis that they generate the most money. Widely called the 'Big Three' model, it drew sharp criticism from smaller and mid-tier boards as a violation of the principle of equal development. The ICC later revised the model toward a more balanced distribution, but the underlying tension has not disappeared.
The core of the argument is that cricket's 'one country, one vote' principle collides with the reality of 'one rupee, one vote'. The board that contributes the most revenue naturally seeks the most control; the board that contributes least seeks equal rights. This collision shapes the future calendar, tournament structure and investment in developing nations.
Rules and governance: DLS, DRS and NOCs
Three rule systems dominate tournament debate. The first is Duckworth-Lewis-Stern (DLS), which recalculates targets in rain-affected matches. Introduced in the late 1990s and refined when Stern joined in 2026, it is still argued to favour one side unfairly in certain situations.
The second is the Decision Review System and its 'umpire's call' provision. Umpire's call means that if the ball is striking the stumps only marginally, the on-field decision stands. It is an honest acknowledgement of technological uncertainty, but it confuses viewers: the ball appears to hit the stumps on screen and the batter still survives.
The third is the No Objection Certificate system, under which a board must permit a centrally contracted player to appear in an overseas league. It is the permanent symbol of the tension between national duty and franchise income. Every refusal restarts the debate over who owns a player's body.
Integrity: three cases cricket can never forget
Cricket's integrity history is marked by three major cases. In 2026, South African captain Hansie Cronje was implicated in match-fixing; the investigation widened and players from several countries were drawn in. It was the moment cricket realised that betting networks could reach the dressing room.
In 2026, a British newspaper sting during the Lord's Test exposed deliberate no-balls by Pakistani bowlers. Players were banned and subsequently jailed in the UK. The case mattered because it proved a whole match need not be sold — a single ball, a single over, a single small event can be.
In 2026, arrests in the IPL over spot-fixing and betting allegations pushed the matter into court and raised questions about how effective monitoring can be amid a fast league calendar and heavy money flow. The ICC's Anti-Corruption Unit exists because of these experiences.
The shared lesson is that integrity crises never announce themselves. They enter quietly and are usually detected long after the damage. A body's integrity system should be judged not by the number of scandals but by its capacity to detect them.
Geopolitics: when borders outside the field step onto it
Geopolitical interference in cricket is not new. Bilateral series between India and Pakistan have not been played since the 2026-13 limited-overs tour; the two sides meet only in multi-nation events such as World Cups and Asia Cups. The cost is not confined to the sport: lost broadcast revenue, reduced audience engagement, and an experience withheld from players on both sides.
The risk map
Any cricket assessment should run across six risk categories: sporting (injury, form, matchup), personnel (captaincy, coaching, contracts), commercial (rights value, sponsor interest, audiences), rules and integrity (disputes, investigations, bans), public opinion (expectation versus reality), and systemic (calendar overload, player unions, macroeconomic conditions).
The least-measured risk is analytical risk: a decision taken on thin or unverified information that is later treated as fact. In sports organisations this is often the most expensive risk of all, because it is invisible and its cost is paid years later.
Public narrative and the expectation gap
In cricket, the gap between narrative and fact is often wide. One brilliant innings makes a 'star'; the next three failures are explained as a 'form problem' when they are simply statistical normality. A team wins a big match and a 'new era' is declared; three months later the same weaknesses reappear.
The reason is that public narrative needs a clear story — hero, villain, twist. Statistics do not tell stories; they show tendencies. A responsible analyst measures the distance between market expectation and objective assessment. Where the gap is wide, both disappointment and over-excitement become likely.
Industry transmission: from youth development to broadcast
Cricket's industry works as a chain. At the top is youth development and talent supply — schools, academies, domestic competitions. In the middle are national teams and leagues, which give that talent a stage. At the bottom are broadcast, commerce, fantasy sport and derivative markets, which extract value from the game.
Any shock at any level — a new rights deal, a rule change, league expansion, a star transfer — ripples through the whole chain. New broadcast money increases funding downstream, which becomes player salaries and academy investment upstream. Rule changes alter strategy, which over years alters the direction of talent supply; T20's expansion has visibly changed the priorities of young batters.
The weakest link is at the top. Investment in youth development pays off a decade later, which is why it always becomes the last priority. Systems that keep that link strong win in the long run, even without immediate reward.
Conclusion: statistics are questions, not answers
Modern cricket analysis faces a paradox. We have more data than ever, and our capacity to read it in context is as limited as ever. Format, role, venue, age and phase — until these five contexts are fixed, no number means anything. And even when they are fixed, a number is a question, not an answer.
Everyone who writes, speaks or decides about cricket carries one obligation: to admit that what we do not know is also part of the report. Where data exists, place it in context. Where it does not, say so. That honesty is not weakness — it is the greatest strength cricket journalism has. An analysis that declares its limits will always be more trustworthy than one that pretends to completeness.